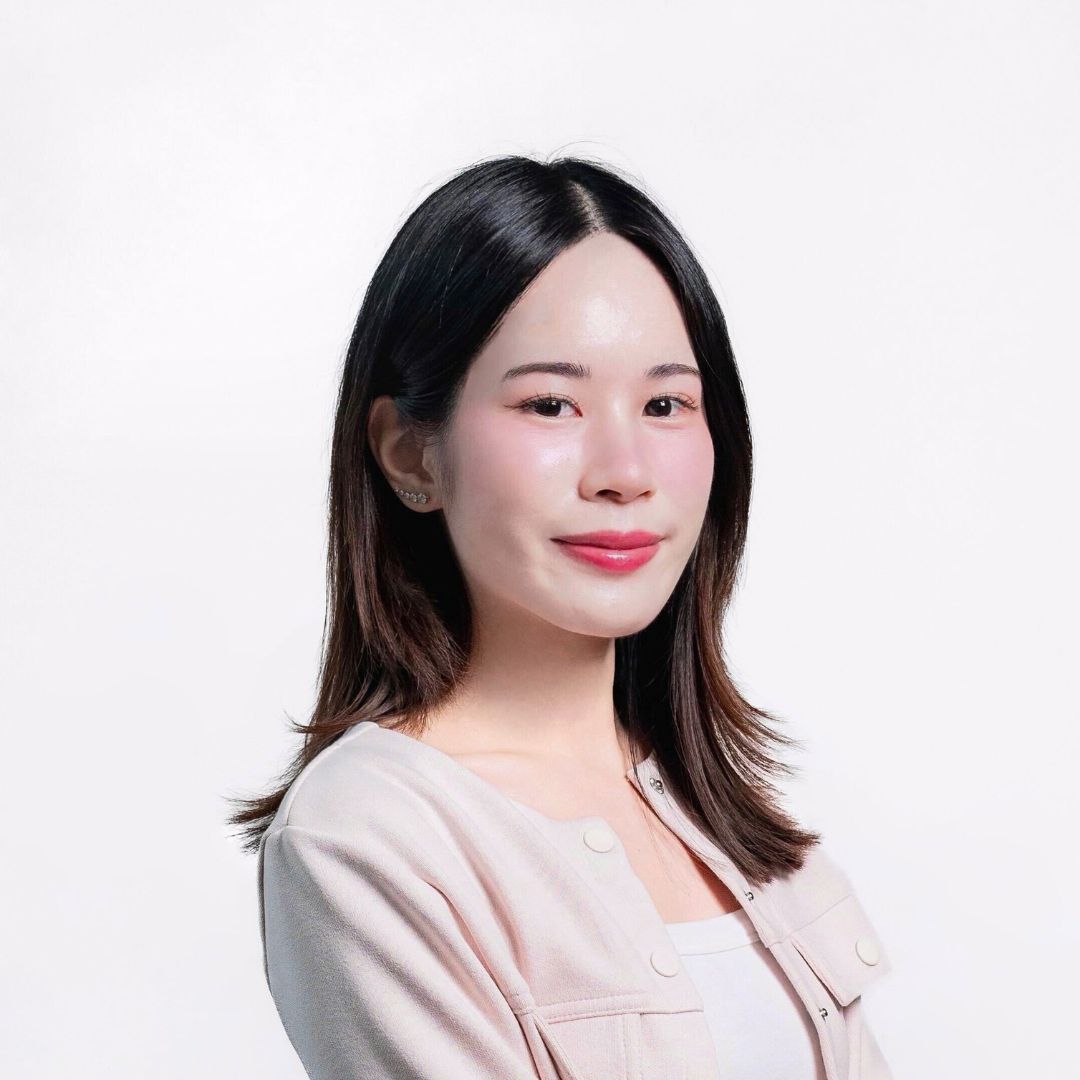
All Posts By

Sukanda Ratchatasomboon

Lazada – All you need to know about automating your Ads Data

By AnalyticsNo Comments

If you are a marketer and have experience working with Lazada data, you might find it time-consuming for the process of manually pulling the data. Fortunately, there’s a more efficient solution! In this article, I will walk you through the process of automating the retrieval of Lazada ads data using the Lazada API.

Also, I share you with a non-coding template in spreadsheet format below which helps you get Lazada data easier. Let’s dive in and make your data analysis much easier and faster!  🤖

Step 1: Prerequisites before you can start

Before diving into the code development process, there are a few essential things you need to complete to ensure a smooth process:

  • Become a developer: Register your account and sign up as a Lazada Developer. This step is crucial to access the Lazada API and utilize its features.
  • Create application: You’ll need to create an application within the Lazada Developer platform. There are various categories to choose from, each with its unique attributes like strategy types, authorization duration, API group permissions, and API call limits. You can read each of them in detail from the reference I provided above. For me, I created an app with the ‘ERP System’ category.

💡 Please note that both the “Become a Developer” and “Create Application” steps may take 2-3 business days for approval from the Lazada Team. In case of any delays, consider contacting the support team through DingTalk for further assistance.

Lazada DingTalk groups

💡 If Lazada requires you to provide call call-back URL, it can be any. Call back URL will be used to retrieve the code parameter which I will use further in the next point

1.1 Get your App Key, App Secret, & Callback URL

  • Once your application is approved, you will receive an app key, app secret, and callback URL, which will be used further for making API calls. To access this information, follow these steps:
    • (A) Go to the App console at the top of the menu panel. You’ll be redirected to Lazada Service Provider Center
    • (B) Navigate to the Development menu and choose App management
    • (C) Click on your specific app
    • (D) Under the ‘App Overview’ section, you’ll see your App key, App secret and Callback URL. Please keep them to later for obtaining
      • Code parameter (which will be used for acquiring access token later in step 2): requires App key and Call back URL
      • Access token and campaign data: requires App key and App secret

Lazada Open Platform page

Lazada Open Platform App Management page.

Lazada Open Platform App Overview page.

  • Code parameter: This is one of the important parameters used for getting an access token later in Step 2. It can be retrieved from an authorization URL which requires your app’s callback URL, and app key as inputs. To structure the authorization URL, follow the format below provided by Lazada Open Platform.

Format of authorization URL from Lazada Open Platform (You can replicate the structure and replace it with your callback URL and App key with the highlighted part in orange) :

https://auth.lazada.com/oauth/authorize?response_type=code&force_auth=true&redirect_uri=${call_back_url}&client_id=${appkey}

Lazada App Authorization URL formatting sample.

1.2 Get your Callback URL Authorization code

After obtaining your personalized authorization URL, open it via a web browser. Select the country where your store operates and provide the username and password from your Lazada Seller Center account. Click the submit button.

Marketyze's Personalized Authorisation URL page.

Upon clicking the sign-in button, you will be redirected to your callback URL, and the URL itself will contain your authorization code. (begin after the word ‘code=’ and end before the ‘&’ symbol)

Please note that the code you retrieved will be valid only once. 🔑

If you run the script and get an error, you’ll need to repeat the steps above to get the code parameter again

By completing these prerequisites, you’ll be well-prepared to move on to the next steps of integrating the Lazada API and automating Lazada ads data with ease. 

Step 2: Ready to Automate Lazada Data!

At this stage, you can choose either to go with (2.1) a non-code or (2.2) a code-based approach, based on your specific circumstances and preferences

Pros and Cons of a code-based and non-code approach to pull Lazada Ads Data.

2.1 Non-code Approach – Utilizing a Free template

For the non-coding part, I’ve prepared a template that makes Lazada automation effortlessly accessible to you – no coding required! Simply follow the step-by-step instructions I’ve provided below.

Please make a copy of the template sheet and you’re ready to go 🙂

It’s recommended that you open the step-by-step guide while you’re using the template to avoid any confusion.

https://app.storylane.io/share/9arwxalzli3n

2.2 Code-based Approach – Understand Lazada API structure and begin Development

For those inclined to develop code yourself, we’ll be focusing on two crucial aspects: (1) generate an access token and use the token to (2) request data from the specified endpoint (in this case, obtaining campaign data).

I’ll demonstrate using Google App Script as the scripting tool. You’ll need to run two functions separately as shown in the visuals below and it’s recommended to separate them into 2 script sheets (one for access token and one for Lazada campaign data) to avoid your confusion

Lazada API structure, focusing on ads data.

(1) Generate access token (for more information: click here)

For all regions, to acquire an access token, you’ll need to use this endpoint: https://auth.lazada.com/rest and path /auth/token/create for requesting Lazada API.

Endpoint definition.

1.1 Build your requested API URL

To build your requested API URL, you’ll need to understand from the documentation what parameters are required.

You can simply read through the details of the structure for your understanding, I’ve also provided you with a code snippet below for each part!

For obtaining the access token from this endpoint, the mandatory parameters include: (1) app_key, (2) timestamp, (3) sign_method, (4) code, and (5) sign

1.2 Obtain the sign parameter.

With most of the parameters ready (app key, timestamp, sign method, and code), the next step is to obtain the sign parameter.

Lazada Open Platform requires a sign as a part of the authentication process for verifying the identity of each API request you make. To obtain this sign, you will need all system and dynamic parameters, page path and your app secret. (obtained from Step 1) Follow these steps to get the sign:

  1. Sort all request parameters
  2. Concatenate the sorted parameters and their values into a string
  3. Add the API name (page path) in front of the concatenated string
  4. Encode the concatenated string in UTF-8 format and make a digest by the signature algorithm (using HMAC_SHA256)
  5. Convert the digest to hexadecimal format with uppercase letters

You may use ChatGPT to assist in coming with code snippets for sign. I’ve provided one sample which you may use as a reference

ChatGPT prompt: 🤖

“Please write JavaScript code for Google app script to generate a signature. Within the same function, please put variable page path, app secret and parameters on the top of the function and follow by:

1. Sort all parameters using the keys object. (Name it as storeys)

2. Concatenate the sorted parameters with key and value. Please make sure key and value joint without having ‘=’ and ‘&’ (Name it as concatenated string)

3. Add page path in front of concatenate string. (Name it as a query)

4. Sign the resulting string using HMAC-SHA256 and make sure to convert the app secret and query to bytes

5. Convert the binary signature to a hexadecimal string and make it upper case. (Name it as signature)”

A code snippet is provided below for obtaining the sign using Google App Script. You may use it as a reference!

				
					var apiUrl = 'https://api.lazada.com/rest';
var pagePath = '/auth/token/create';
var timestamp = new Date();
var milliseconds = timestamp.getTime();
var appSecret = 'xxxxxxxxxxxxxxxxxxxxx'; // Replace with your app secret
var parameters = {
    sign_method: 'sha256',
    timestamp: milliseconds,
    app_key: '123456', // Replace with your app key
    code: '0_123456_Vw9SU8FsIFEoc4eb5lCBAO1p25887', // Replace with your code
};

// Step 1: Sort parameters by keys
var sortKeys = Object.keys(parameters).sort();

// Step 2: Concatenate sorted parameters with key and value
var concatenatedString = sortKeys.map(key => key + parameters[key]).join('');

// Step 3: Add page path in front of concatenated string
var query = pagePath + concatenatedString;

// Step 4: Convert appSecret and query to bytes & Generate HMAC-SHA256 signature
var appSecretBytes = Utilities.newBlob(appSecret).getBytes();
var queryBytes = Utilities.newBlob(query).getBytes();
var signatureBytes =
    Utilities.computeHmacSignature(Utilities.MacAlgorithm.HMAC_SHA_256,
    queryBytes, appSecretBytes);

// Step 5: Convert binary signature to hexadecimal and uppercase
var signature = signatureBytes.map(function(byte) {
return ('0' + (byte & 0xFF).toString(16)).slice(-2);
}).join('').toUpperCase();
				
			
1.3 Construct the URL.

Once you have all the necessary elements, let’s construct the requested URL! The URL should include the API’s path and required parameters in the following format.

				
					var url = apiUrl + pagePath +
    '?code=' + parameters.code +
    '&app_key=' + parameters.app_key +
    '&sign_method=' + parameters.sign_method +
    '&timestamp=' + milliseconds +
    '&sign=' + signature ;


Sample of requested URL

1.4 Get your store’s token

After encoding the URL and sending the request, you should receive the token for your store, which will be used for further requests to access the endpoint for campaign data retrieval.

				
					var encodedTokenUrl = encodeURI(url); // Encode the URL to make sure it's properly formatted
var response = UrlFetchApp.fetch(encodedTokenUrl); //Fetch data from encoded URL
var data = JSON.parse(response.getContentText()); // Parse the fetched response data as JSON
var accessToken = data.access_token; // Extract the access token from the parsed data

Logger.log(accessToken);


Please keep in mind that the generated token has a validity of 30 days.🔑

(2) Get campaign data (for more information: click here)

To fetch campaign data, you’ll need to use the endpoint that matches the location of your store. Currently, Lazada API supports for 6 countries.

In this case, I will use the Thailand endpoint, which is https://api.lazada.co.th/rest , followed by the path that provides the necessary marketing metrics: /sponsor/solutions/campaign/searchCampaignList.

2.1 Construct your API URL 

Similar to generating the token, you’ll construct your requested API URL.

For the path /searchCampaignList, required parameters include (1) app_key (2) timestamp (3) access_token (4) sign_method (5) sign (6) bizCode (7) startDate (8) endDate (9) pageNo (10) pageSize

Overview on getting your Lazada campaign's data.

2.2 Get a sign parameter 

For this endpoint, there’s no requirement for a code parameter but you still need to acquire a sign parameter, just as you did when generating the access token. [Refer to (1) Generate access token]

A code snippet provided below is an example of how you can set up your script by having it run in a loop to get Lazada Ads at daily level. Feel free to use it as a reference!

However, don’t forget to make changes on some variables which are client_name appSecret start end app_key access_token.

				
					var client_name = 'xxxxx'; // Replace with your name [can be any]
var sheetName = 'LZD_Campaign_' + client_name;
var apiUrl = 'https://api.lazada.co.th/rest' ;
var pagePath = '/sponsor/solutions/campaign/searchCampaignList' ;
var body = null;
var appSecret = 'xxxxxxxxxxxxxxxxxxxxx'; // Replace with your app secret

// define start and end dates
var start = '2023-08-01'; // Replace with your desired start date
var end = '2023-08-31'; // Replace with your desired end date

// Convert start and end to Date objects
start = new Date(start);
end = new Date(end);

// Check if the "{Client name} sheet" sheet already exists
var ss = SpreadsheetApp.getActiveSpreadsheet();
var sheet = ss.getSheetByName(sheetName);

if (sheet) {
sheet.clearContents();
} else {
    // If it doesn't exist, create a new sheet
    sheet = ss.insertSheet(sheetName);
    }

// Append column name when insert new sheet, can adjust based on your need
sheet.appendRow(['date','campaign_name' , 'campaign_id', 'daily_budget' ,
'spend' , 'impressions' , 'clicks' , 'cpc' , 'ctr' , 'store_revenue',
'store_roi', 'store_orders', 'store_unitssold', 'start_date','end_date']);

// loop through each day in the range [to get daily data]
for (var day = start; day <= end; day.setDate(day.getDate() + 1)) {
var dateString = day.toISOString().split('T')[0]; // get date in YYYY-MM-DD
var timestamp = new Date();
var milliseconds = timestamp.getTime();
var parameters = {
    app_key: '123456', // Replace with your App Key
    timestamp: milliseconds,
    sign_method: 'sha256',
    startDate: dateString,
    endDate: dateString,
    bizCode: 'sponsoredSearch',
    pageNo: '1',
    pageSize: '100',
    access_token: 'xxxxxxxxxxxxxxxxxxxxxx'// Replace with your Access Token
};

// Step 1: Sort parameters by keys
var sortKeys = Object.keys(parameters).sort();

// Step 2: Concatenate sorted parameters with key and value
var concatenatedString = sortKeys.map(key => key + parameters[key]).join('');

// Step 3: Add page path in front of concatenated string
var query = pagePath + concatenatedString;

// Step 4: Convert appSecret and query to bytes & Generate HMAC-SHA256 signature
var appSecretBytes = Utilities.newBlob(appSecret).getBytes();
var queryBytes = Utilities.newBlob(query).getBytes();
var signatureBytes =

Utilities.computeHmacSignature(Utilities.MacAlgorithm.HMAC_SHA_256,
queryBytes, appSecretBytes);

// Step 5: Convert binary signature to hexadecimal and uppercase
var signature = signatureBytes.map(function(byte) {
return ('0' + (byte & 0xFF).toString(16)).slice(-2);
}).join('').toUpperCase();
				
			
2.3  Construct the requested URL

Once you have all the necessary elements set up, let’s construct the requested URL! The URL should include the API path and the required parameters in the specified format.

				
					var url = apiUrl + pagePath +
'?bizCode=' + parameters.bizCode +
'&endDate=' + parameters.endDate +
'&startDate=' + parameters.startDate +
'&pageNo=' + parameters.pageNo +
'&pageSize=' + parameters.pageSize +
'&app_key=' + parameters.app_key +
'&sign_method=' + parameters.sign_method +
'&access_token=' + parameters.access_token +
'&timestamp=' + milliseconds +
'&sign=' + signature ;


Sample of requested ULR to get your Lazada's campaign data.

2.4 Successful Retrieval of Data

 After encoding the URL and sending the request, you will successfully retrieve campaign data from the Sponsored Solutions!

I’ve provided you with a code snippet on how to append data to your sheet. For this case, the code will filter only campaign data with spending more than zero.

				
					var encodedApiUrl = encodeURI(url);
var response = UrlFetchApp.fetch(encodedApiUrl);
var data = JSON.parse(response.getContentText());
console.log(encodedApiUrl); // To view concatenate URL
console.log(data); // To view result

// Loop over all campaigns in the response
for (var i = 0; i < data.result.length; i++) {
var campaign = data.result[i];
var spend = campaign.spend;
var storeRevenue = campaign.storeRevenue;
var spend = campaign.spend;
storeRevenue = storeRevenue.replace('THB ', '');
spend = spend.replace('THB ', '');

// Convert spend to a number for comparison
var spendValue = parseFloat(spend);
if (spendValue >= 1) {
var metrics = {
    date: parameters.startDate,
    campaign_name: campaign.campaignName,
    campaign_id: campaign.campaignId,
    daily_budget: campaign.dailyBudget,
    spend: spend,
    impressions: campaign.impressions,
    clicks: campaign.clicks,
    cpc: campaign.cpc,
    ctr: campaign.ctr,
    store_revenue: storeRevenue,
    store_roi: campaign.storeRoi,
    store_orders: campaign.storeOrders,
    store_unitssold: campaign.storeUnitsSold,
    start_date: campaign.startDate,
    end_date: campaign.endDate
};
var rowData = Object.values(metrics);
sheet.appendRow(rowData);
}
}
}


We hope you found the information we provided useful! 🌟 If you have any questions or need further assistance in understanding anything, don’t hesitate to reach out to us at analytics@marketyze.io or kung@marketyze.io Happy to help and discuss further on the topic!

The Complete Comparison between Universal Analytics and Google Analytics 4: Everything You Need to Know About the Upgrade

By AnalyticsNo Comments

If you are working in the digital marketing field, you might have heard the name “Google Analytics (GA)”. It is a web analytics tool offered by Google that helps collect data, such as website traffic and user behavior. Currently, there are 2 versions available for use – Universal Analytics (UA or GA3) and Google Analytics 4 (GA4).

According to Google’s announcement, Universal Analytics will sunset on the 1st of July, 2023, which means no more data will be processed since that period. This automatically forces Universal Analytics users to migrate to Google Analytics 4.

But no worries! Before Google Analytics 4 completely replaces Universal Analytics from this half-year-end, there’s still time to explore and get ready!🙂 This article will highlight some key differences between the two properties to help you understand what changes and upgrades have been made by focusing on the web analytics case!

From Universal Analytics to Google Analytics 4

Universal Analytics first launched as a beta version in 2012 and later opened to the public in 2013. As of today, it has been over 10 years since its debut. However, in 2020, Google officially introduced the next generation of Google Analytics – Google Analytics 4.

Timeline for the transition of Universal Analytics to Google Analytics 4.Google Analytics 4 has mainly been designed to enhance measurement capability and address the limitations of Universal Analytics. For example, it allows data collection from both websites and apps; eliminating the need for separate platforms for Google Analytics 4 and Firebase. Also, it emphasizes customer privacy and includes predictive features.

6 Major differences between Universal Analytics and Google Analytics 4

1. Data collection model

One of the most significant changes from Universal Analytics (UA) to Google Analytics 4 (GA4) is the shift in data collection. GA4 is focusing on capturing event-based data instead of session-based data like it’s been in UA. This gives more flexibility in tracking the user journey

For UA, you might be familiar with multiple forms of hits (specific interactions of users on the website), such as page hits, event hits, eCommerce hits, and social interaction hits but here in GA4, every hit type will be captured as an event, allowing for more granular tracking

The transition of session-based data to event-based data from Universal Analytics to Google Analytics 4.Besides, the way event data has been stored differs between the two properties. In UA, the report has been displayed in the form of Category, Action Label, and Value, while GA4 doesn’t follow the same data schema and displays all data in terms of events, based on the new data model.

New data model from Universal Analytics to Google Analytics 4.Another distinction in the data model is the processing time. UA hits take roughly 4 hours to proceed (however, from my experience, it’s faster than that) but events in GA4 process slowly and may take up to 72 hours. So, when viewing the report on GA4, please keep in mind that data might be delayed.

2. User and Session calculating method

If you have migrated to Google Analytics 4 (GA4) but still use Universal Analytics (UA), you may have noticed that the number of users and sessions in both properties don’t match. This is due to the difference in data models and how each property defines its metrics.

For users, UA counts the number of users based on cookies and client ID (1 ID represents 1 user or 1 device). For example, if a person enters your website three times but across different devices, the number of users reporting to UA will be three. On the other hand, the number of users displayed on GA4 will be one since it’s calculated based on User ID which is data from Logging in Google Account. Thus, the GA4 model is trying to capture data more accurately and on point

The shift from client IDs to user ID from Universal Analytics to Google Analytics 4.For sessions, both UA and GA4 have similarities in counting sessions but are also different in some aspects. Both initiate counting when users enter the website page and consider the session ends by default after 30 minutes of inactivity. GA4 automatically generates both session ID and session number when the session starts

What’s different is that GA4 won’t create new sessions if the campaign source changes during sessions or the sessions cross a day boundary (at midnight), while the UA session covers all these circumstances. This may result in a lower session count in GA4.

Reduced session count after migrating from Universal Analytics to Google Analytics 4.3. Data retention

The data retention period is one of the big differences since in Google Analytics 4 (GA4) you can store event data for a maximum of 14 months, with age, gender, and interest data having a limit of 2 months. This is unlike Universal Analytics (UA) where event data can be retained indefinitely.

Reduced in data retention from an indefinite period to a maximum of 14 months from Universal Analytics to Google Analytics 4. However, it’s worth noting that the data retention policy only applies if you want to create in-depth reporting from the exploration feature in GA4. Other than that, you are still able to view the report beyond the 14-month periods on standard reporting.

Standard reporting and in-depth reporting on Google Analytics 4.Thus, it’s important to be aware of this change, especially for marketers who usually create in-depth reports or long-term analysis reports.

Additionally, by default, GA4 set the data retention period to 2 months. If you want to keep data for a longer period, you probably need to change it yourself by going to ‘Admin’-> Under Property column select ‘Data settings’ -> select ‘Data Retention’ -> select ‘14 months’-> ‘Save’.

Steps to change data retention in GA4.However, please keep in mind that once you change the period, the change will not be retroactive and you’ll have to wait for new data to get stored. Then it’s recommended to start early if you want to store data for a more extended period.

4. Bounce rate to Engagement rate

Normally to measure site engagement, in Universal Analytics (UA) you probably focus on Bounce rate which is the percentage of all sessions on your website in which users viewed only a single-page web. Nevertheless, this can be ineffective in some cases because if users view one page, for example, read the article, and leave the website, it’s still considered a bounce session – even if the user engages with your website by reading.

New bounce session and engaged session model in Google Analytics 4.To address this issue Google Analytics 4 (GA4) introduced the Engagement rate by aiming to measure user interaction with your website more accurately – no matter if users only visit one page on the site. The engagement rate is derived from engaged sessions divided by total sessions. To be counted as engaged sessions, the user needs to meet one of these criteria following:

  • Last active for 10 seconds or longer
  • Has one or more conversion events fired (To measure with this criteria, you first need to set your conversion in GA4 property)
  • Involve two or more pageviews

Any session that doesn’t meet these criteria will be considered a bounce session.

Google Analytics definition of engaged session.By the new definition of the engagement session, I also agree that it helps measure how users engage with the website page more accurately and on point in keeping with its name.

5. Integration with BigQuery

One of the benefits you will get from Google Analytics 4 (GA4) is the free integration of BigQuery. Previously in Universal Analytics (UA), this feature is only available to customers who subscribe paid plan, Google Analytics 360. It used to be huge gaps between the free version and paid version but right now it’s free to use. You’re able to export data to BigQuery and utilize data to further analyze and gain insight.

Free integration with BigQuery with Google Analytics 4 while a paid version of Universal Analytics is needed to integrate with it.From my point of view, the free integration with BigQuery could be a replacement for the data retention policy, which has been shortened in GA4 compared to UA as discussed in point number 3.

6. Custom report

One notable contrast between the two generations of Google Analytics is a custom report. Google Analytics 4 (GA4) offers a wider range of customizable report options, each has been designed to serve specific analytics purposes, for example, funnel analysis, user journey analysis, and individual behavior analysis. In contrast, Universal Analytics (UA) provides only two primary options for custom reporting – a general custom report and a dashboard

Wider range of custom reporting from Universal Analytics to Google Analytics 4.I feel that the interface of the report in GA4 is more modern and user-friendly. Especially the drag-and-drop feature as it allows you to view the report immediately after dropping the metric/dimension, compared to UA where you need to select metrics and dimensions first, save them, and then view the report.

However, due to the wide range of report options in GA4, you might need time to get familiar with them and know which type of report can address your specific needs.

Then what should be the next step for you if you’re still using Universal Analytics and have not migrated to Google Analytics 4?

As there’s still time before Universal Analytics (UA) stops processing data, I suggest you use both Universal Analytics (UA) and Google Analytics 4 (GA4) in parallel. This way, you can familiarize yourself with the new feature and user interface of GA4 before the cut-off date on July 1st, 2023.

According to a Google update, since the beginning of March 2023, if you haven’t already created the GA4 property, Google will create one for you based on your setting in UA, unless you choose to opt out.

It’s essential to keep in mind that once the cut-off date arrives, data will stop reporting in UA. However, access to reports will still be available for at least the next six months after the cut-off date. You can further find information on how long UA will remain available after the first of July, 2023 by checking here

Future timeline for the transition from Universal Analytics to Google Analytics 4.Now it’s your turn! 😀, I’d love to hear from you how this article is useful and easy to understand for you. Also If you have any related questions or are interested in our BI services, feel free to contact us via email at analytics@maketyze.io. We’ll be more than happy to help.

Key differences summary between Universal Analytics and Google Analytics 4.

A Complete Guide to Data Visualization Tool

By Analytics2 Comments

It is undeniable we live in a world that is full of data. Our field, digital marketing, is one of the sectors that heavily utilizes data to gain insights and drive business growth. However, sorting through large amounts of data is difficult!

Data visualization tools, like Looker Studio, Power BI, and Tableau, help simplify data by creating clear visuals.

In this article, we will compare these tools based on 7 features using a 5-point rating system and a weighted decision matrix. A summary table will determine the best tool for a digital marketing agency environment.

Get to know each tool:

Before we look at the features, below is a short introduction to each of the three tools and their histories 🙂

Power BI

Power BI is a business intelligence and data visualization tool for converting data from various sources into reports or dashboards. At first, it was named Project Crescent, which was designed by a team at Microsoft and available for public download in 2011. Later it was renamed to Power BI for Office 365 and unveiled by Microsoft in 2013.

Power BI logo history

Tableau

Tableau is a business intelligence and data visualization tool for data analysis that helps simplify large volumes of raw data into understandable worksheets and dashboards. It was first launched in 2003 by Tableau Software; a software company in the US and has since been acquired by Salesforce in 2019.

Tableau logo transition

Looker Studio

Looker Studio is a cloud-based and open-source data visualization tool that helps turn data into informative, easy-to-read, easy-to-share, and customized reports and dashboards. It was launched by Google in March 2016 as a part of the Google Analytics 360 suite under the name “Google Data Studio”. In October 2022, it was rebranded to Looker Studio and became a part of the Google Marketing Platform.

Looker studio logo transition

Comparison of 7 key features

1. Device & OS Compatibility (Weight 20%)

(Power BI – 4 | Tableau – 5 | Looker Studio – 5)

When considering which data visualization tool to use, it’s important to make sure that the tool is compatible with your device’s operating system, with the most popular operating systems being Mac OS and Windows OS.

All three tools, Looker Studio, Power BI, and Tableau, are compatible with Windows OS. Looker Studio and Tableau also support Mac OS, while Power BI is the only tool that does not currently support Mac OS. So, if you are using a Mac OS device and looking to use any of these tools, Looker Studio or Tableau might be the best choice for you.

OS compatibility comparison between Power BI, Tableau and Looker Studio.

Looker Studio is a cloud-based service and can easily be accessed through a web browser, whereas it’s recommended to use the desktop version for Power BI and Tableau.

Cloud-based services comparison between Power BI, Tableau and Looker Studio.

Even though Power BI does not support Mac OS, in other ways, if you or your company is using other Microsoft products, you could benefit from using Power BI due to it being in the Microsoft ecosystem; for example, familiarity with the user interface or the ease of integrating with other Microsoft products. Like Power BI, the same applies to Looker Studio; users staying in the Google ecosystem may find this visualization tool simpler and more convenient to use.

Comparison of Google and Microsoft tools on Mac and Windows.


2. Pricing (Weight 20%)

(Power BI – 3 | Tableau – 2 | Looker Studio – 5)

When comparing BI tools, one important factor to consider is pricing. Each tool may have multiple pricing options.

Looker Studio stands out when it comes to cost, as it is completely free to use. This makes it a great option for small businesses or startup companies that are just starting to incorporate data visualization into their operations. It could be an ideal choice, as the end-to-end process of creating visualization is free of any cost.

Pricing comparison between Power BI, Tableau and Looker Studio.

Power BI and Tableau also have a free version for users but they come with limitations in sharing and collaborating capabilities. For example, with the Power BI free license type, you are able to create content but cannot share them with other users, unless you decide to publish them to the public web. Not super convenient if any of the data shown is confidential.

Power BI desktop demonstration.

Power BI’s above concept also applies to Tableau as it offers a free version called Tableau Public which can only be accessed through a website. (https://public.tableau.com). The good: features are the same as the desktop version. The bad: there are limitations in terms of data confidentiality when publishing to the public web.

Tableau public demonstration.

In conclusion, the free versions of Power BI and Tableau are not suitable for use within a business or for commercial purposes.

If you choose to go with a paid version, Power BI has two options: an individual user license starting at $9.99 per month per user, and an organization license at $4,995 per month per capacity. Tableau’s pricing, on the other hand, is based on the specific needs of the user.

Power BI pricing plan.

The cheapest one is Tableau Viewer license costing $15 per month per user for only the ability to view, comment, and interact with dashboards. To create content, it’s required to subscribe to Tableau explorer license at $42 per month per user, with the cost potentially adding up to $70 per month per user if you would like to prepare data within Tableau Prep Builder by subscribing to Tableau creator license.

Tableau pricing plans.

And so, for dashboard creation, Power BI is cheaper than Tableau. But again, Looker Studio is (for now) free.

It’s important to keep in mind that comparing the pricing, or cost, of these tools is crucial for any organization that wants to select the best fit for them. Depending on the scale, functionality and usage of the organization can make one tool more or less appealing in terms of cost.

3. User Access (Weight 20%)

(Power BI – 2 | Tableau – 3 | Looker Studio – 4)

Say, like us, you serve multiple clients. The share feature should definitely be a factor taken into consideration as dashboards may contain sensitive information

Sharing and collaborating on Looker Studio is easy to do as you can share your reports or dashboards to external users by entering their email address. Actually, this is easy for both internal and external sharing. One constraint is that it requires a person to have a Google account, such as a Gmail account, to get shared.

Looker Studio ease of sharing.

When it comes to sharing Power BI reports, there is an extra step that needs to be taken. Reports must be published to the Power BI service (app.powerbi.com) first. Additionally, users must have a Pro license to share content, and those who will be viewing the report must also have the same license type. For example, if the person creating the report in your company has a Power BI Pro license, your clients must also have Pro licenses in order to interact with the dashboards. The downside of this is that it can be an added complexity for clients, as they are required to pay for a license to access the information.

Power BI sharing services.

Additionally, for Power BI, another way to share content with external users is to purchase a Premium capacity license type for the company. However, this approach comes with a large cost at almost $5,000 per month – not worth it if your organization is relatively small.

Power BI sharing criteria and chart.

For Tableau, sharing is similar to Power BI but more straightforward: first, you need to publish worksheets to Tableau Server, then you can share the visualizations with other people by sending a link or an email. Just remember: clients – or external users – need at least a Tableau Viewer license.

Tableau sharing steps.

4. Load Speed and Tool Stability (Weight 12.5%)

(Power BI – 4 | Tableau – 5 | Looker Studio – 2)

When it comes to the three BI tools, load speed is a crucial factor, as no one wants to wait around for a dashboard to load.

Looker Studio falls behind the other two options. The more functions or components you add to your report, like visualizations, icons, or large amounts of data (like 100,000 or more rows), the slower the report will become. When using Looker Studio, you may need to refresh the screen more frequently to keep the tool stable.

On the other hand, Power BI and Tableau are better options for load speed and smooth interactions among visualizations. These tools are also more stable and can handle large amounts of data without any errors. So, if you’re looking for a fast and stable tool, Power BI or Tableau might be the better choice for you.

Load speed comparison between Power BI, Tableau and Looker Studio.

If comparing between tools looking purely at the maximum volumes of data they could support, Tableau outperforms Power BI, as Power BI can handle a limited volume of data at only 10 GB unless it’s required to use a cloud service like Azure; Tableau does not have a data size limit and can handle as much data as your local storage can handle without any requirement for cloud service.

Volume of data comparison between Power BI and Tableau.


5. Visualization & Customization (Weight 12.5%)

(Power BI – 4 | Tableau – 5 | Looker Studio – 3)

Different specific options of visualization are core criteria for evaluating data visualization tools, as in the name! From a marketing perspective, all three tools, Looker Studio, Power BI, and Tableau, provide in-built basic visualizations that are essential for data analysis. These include charts like bar charts, column charts, combo charts, line charts, pie charts, area charts, heatmap tables, maps, and treemaps.

Data visualisation and customisation comparison between Power BI, Tableau and Looker Studio.

Apart from types of visualizations, report customization also plays an important role to make visuals look nice and more appealing. Below is a small breakdown of specific customization options per tool:

  • Color: When it comes to adding color to your reports or dashboards, all three tools offer similar options. Power BI and Looker Studio allow you to set a consistent theme color across the entire report, while Tableau puts more emphasis on conditional formatting. This allows for increased visibility and customization, allowing you to focus on the important aspects of your data. Tableau also provides more granular options, giving you a wide range of color palette options and the ability to adjust the number of stepped colors. It’s worth noting that Looker Studio does not have the option of conditional formatting for certain visualizations like bar charts, and the users can only select a single color representing that data field.

Colour comparison between Power BI, Tableau and Looker Studio.

  • Size: Within all three tools, you are able to adjust the size of your dashboard and report pages. The size of visualizations is also adjustable, by selecting and dragging frames to freely resize. Additionally, Tableau is more detailed in resizing bars or columns in charts.

Size comparison between Power BI, Tableau and Looker Studio.

  • Text and font: You can add texts and also have several options for font styles and sizes. Additionally, you can make granular adjustments, such as editing titles, labels, or legends separately.

Text and font comparison between Power BI, Tableau and Looker Studio.

  • Filter: The filter feature comprises filtering data on specific visuals, selected pages/reports, and all pages/reports. Tableau has the greatest filter functions as you are able to do everything by selecting. Filtering on specific visuals, or selected pages is also available in Power BI and Looker Studio, but you need to manually add filters to each visualization or each page yourself.

Filter comparison between Power BI, Tableau and Looker Studio.

  • Images or icons: All three tools allow you to add images and make them clickable to external websites or pages within the reports. Power BI offers additional action types of clickable images, such as asking Q&A. Tableau provides separate features of page navigation and Q&A, in addition to clickable images to external websites.

Images and icons comparison between Power BI, Tableau and Looker Studio.

Overall, all three tools provide enough visualization options for data analysis in digital marketing, however, the granularity of customization varies among the tools; in descending order from Tableau to Power BI to Looker Studio.


6. Use Interface & Navigation (Weight 7.5%)

(Power BI – 4 | Tableau – 3 | Looker Studio – 5)

Overall, Looker Studio, Power BI, and Tableau have straightforward interfaces and easy-to-understand navigation in terms of tool panels and report tabs. Most guides and descriptions of each function are provided when you hover over the icons.

User interface and navigation comparison between Power BI, Tableau and Looker Studio.

Toolbars are at the top of the screen for all tools. Looker Studio and Power BI are similar in that their data and customization panel is on the right side of the screen whereas Tableau’s is on the left.

By default, both Power BI and Tableau have a page or report tab at the bottom of the screen whereas Looker Studio’s is on the left.

Power BI user interface.

Looker studio user interface.

Tableau user interface.

Three of them have drag-and-drop functionality. Tableau has a bit of a plus here: it can automatically generate a visualization that suits the type of data once you drag it into the worksheet, making further adjustments after.

Tableau automatic visualisation generator.

For Power BI and Looker Studio, you’ll think first what type of visuals you need and then drag data into the dimensions and metrics sections.

Data input and visualisation generation comparison between Power BI and Looker Studio.

However, due to the complexity level of features in Power BI and, especially, Tableau, it could make their interface complicated for beginner users who need time to become familiar. On the other hand, Looker Studio has a clean and intuitive interface but it trades off with fewer functions.


7. Creating Custom Fields (Weight 7.5%)

(Power BI – 5 | Tableau – 5 | Looker Studio – 4)

Custom fields, such as calculated fields, can be extremely useful for marketing analysis. All three tools, Looker Studio, Tableau, and Power BI, allow you to create calculated ratios or metrics using basic formulas and operators commonly used in spreadsheets.

However, when it comes to more advanced formulas for transforming data, each tool has its own unique capabilities. Power BI, for example, offers deeper DAX (Data Analysis Expression) functions. Tableau has the LOD (Level of detail) expression, giving you more control over the level of granularity you want to compute.

Creating custom field comparison between Power BI, Tableau and Looker Studio.

List of functions of each tool

Power BI documentation

Tableau documentation

Looker Studio documentation

More advanced features and higher levels of granularity, in turn, come with a higher learning curve and more technical knowledge.

Which tool is the best?

After reading about the comparisons between these three tools, you may be wondering which one is the best fit for you, your digital marketing agency, or in other scenarios. Each tool has its own strengths and weaknesses, so it’s important to consider which features are most important to you. In this article, we’ve provided a summarized table to help you make your decision.

Based on the features we gave the highest priority to – device & OS compatibility, pricing, and user access – Looker Studio comes out as the winner. However, it does have some weaknesses in areas like load speed and customization options.

Keep in mind that the weight given to each feature can be adjusted depending on what’s most important to your company. We would definitely encourage you to use the summarized table provided to evaluate your decision and see how the results compare!

Comprehensive summary infographics of the comparison between Power BI vs Tableau vs Looker Studio created by Marketyze, a digital marketing agency.

Q&A

1. Are coding skills a must to create stunning reports and dashboards?

No, Looker Studio, Power BI, and Tableau do not require coding skills. They allow you to easily create and customize your reports with a drag-and-drop interface. And don’t worry if you are not a coding expert, these tools cover simple formulas and syntax for data transformation that are easy to learn!

2. How many data sources can Looker Studio, Power BI, and Tableau connect with?

All of them have got you covered with hundreds of connectors from Google Sheets to various SQL servers and even CRM platforms. Both Tableau and Power BI provide a wide range of file and database connectors, with Power BI you can additionally integrate with various Microsoft products. Looker Studio offers free connectors from Google and over 500 partner connectors of which some may require an additional fee.

3. Are dashboards by Looker Studio, Power BI, and Tableau able to stay fresh and up-to-date?

Yes! All three have automatic data refresh options which will make it easy for you to update your data sources, so you always have the most current and up-to-date information

4. What kinds of companies are Tableau and Power BI fit for?

If you have an affordable budget and want advanced analysis, such as machine learning or forecasting, both tools are great options for you. However, you can narrow down your options:

  • If your company is medium to large in size and already in the Microsoft ecosystem, Power BI would be a greater fit.
  • However, if you need high-detailed customizations and deal with a large volume of data, Tableau might be a better choice.

5. Comparing Power BI and Tableau, which one has a steeper learning curve for beginner users?

If you are new to data analysis, Tableau will be a bit more challenging for you as the tool is geared towards experienced data or business intelligence analysts and requires advanced analytics skills to fully utilize its capabilities. On the other hand, Power BI has a plus that its interface is similar to other Microsoft products.

We’d love to hear from you if, and how you apply our summarized table to evaluate your decision! If you need any help or are interested in Business Intelligence service, please feel free to contact us via email: 

en_USEnglish

Our website uses cookies and other tracking technologies to improve your browsing experience as set in our Privacy policy.

Privacy Preferences

You can turn your cookie settings on and off. Cookies of each type are available on request, except for necessary cookies.

Allow All
Manage Consent Preferences
  • Necessary cookies
    Always Active

    These cookies are strictly necessary for the operation of our website. You cannot disable these cookies.

Save